
Actions
Monitoring via Grafana » History » Revision 1
Revision 1/5
| Next »
manawyrm, 04/19/2022 08:52 PM
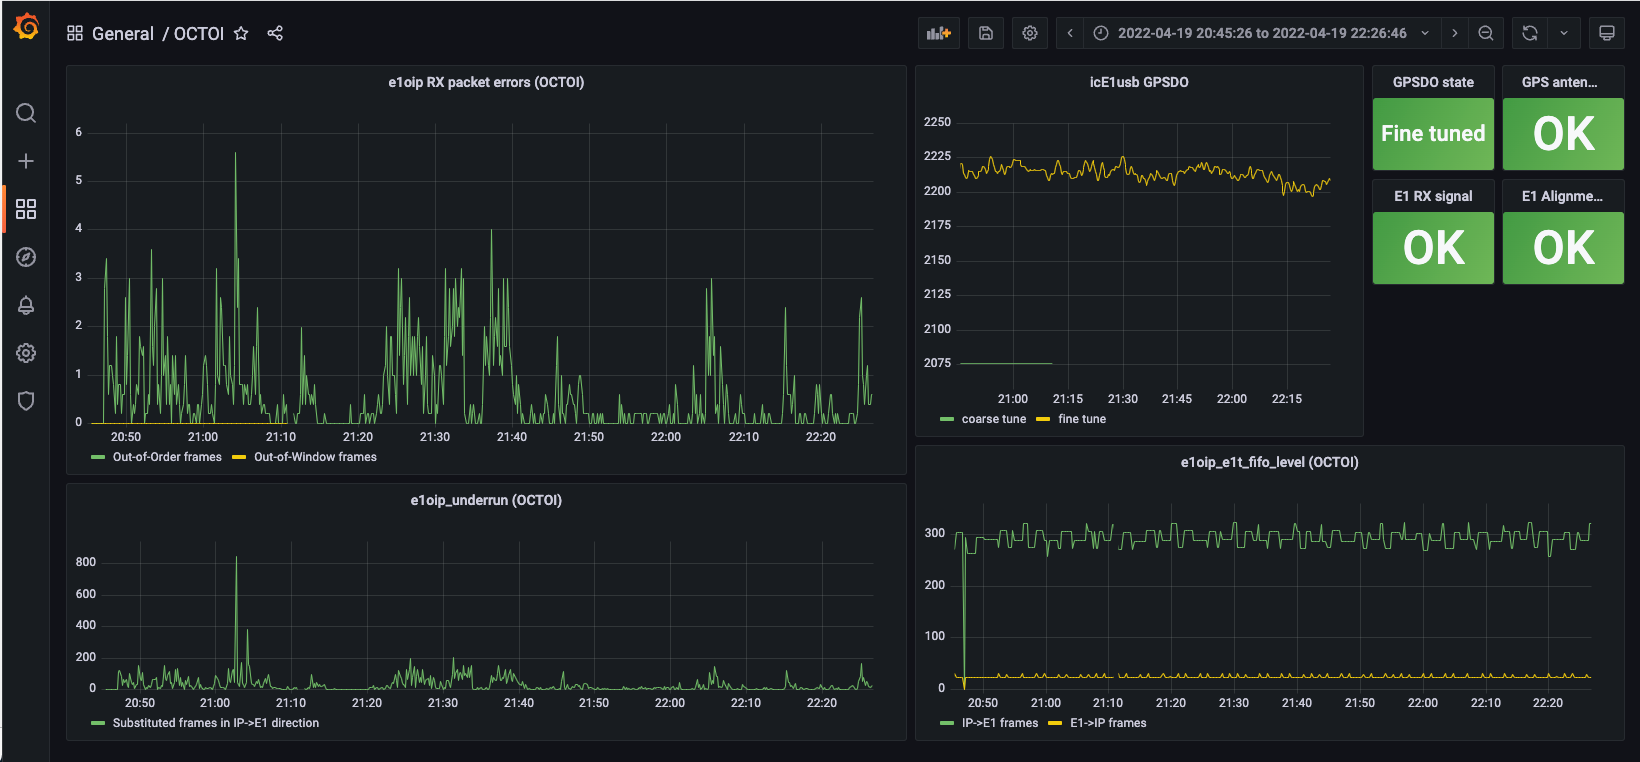
Grafana can be used to monitor the performance of the network connection and osmo-e1d/icE1usb.
When using Grafana + Prometheus, use statsd_exporter ([[https://github.com/prometheus/statsd_exporter]]) to receive the statsd-UDP-messages and report them to Prometheus.
- install Grafana + Prometheus
- install statsd_exporter
- configure Prometheus to query statsd_exporter (add to scrape_configs in
/etc/prometheus/prometheus.yml):- job_name: 'statsd_exporter' scrape_interval: 5s static_configs: - targets: ['localhost:9102'] - add the following config snippet to
osmo-e1d.cfg:stats interval 10 stats reporter statsd remote-ip 127.0.0.1 remote-port 9125 level global no prefix enable
(note the different port) - add Prometheus as a Data Source in Grafana via GUI
- install dashboard from .json dump below
- (optional) change data sources according to OCTOI remote IP/port
A pre-made dashboard is available: [[https://gist.github.com/Manawyrm/714dc4d21c41d672583022e5329ba1fd]]
Updated by manawyrm about 2 years ago · 1 revisions

